How I trade
A written rule set, a daily report that turns it into decisions, and a log that checks whether any of it works. This runs on a live Interactive Brokers book that has held up to about US$87K. The results, including the bad ones, are in section 4.
1. The rules
Nine sections, v1.0 from June 2026. The order never changes: survive first, compound second, learn third. Sizes get decided before signals.
| Risk unit | 1R = 0.5% of account equity, marked weekly. Each tactical trade risks at most 1R from entry to stop. The stop distance sets the size, never the other way round. Minimum stop is 1.25 × ATR(5). |
|---|---|
| Portfolio heat | Open tactical risk capped at 3R. Max two tactical setups at a time. If a trade would break either cap it doesn't happen, no matter how good it looks. |
| Factor caps | Leveraged ETFs count at their multiplier. AI/semis beta capped at 60% of equity delta-adjusted, levered vehicles at most 25% of that; metals 20%; any single name 15%. |
| Three lanes | Core (unlevered index and mega-caps, sized to survive a −20% factor drawdown), rented leverage (defined entry, price stop, time stop, scale-out; never just held), and a hedge lane bought only when implied vol is in the bottom quartile of its 13-week range. |
| Playbook selector | Each morning the modeled dealer-gamma regime and the event calendar pick one of three playbooks: A (fade, positive gamma), B (trend, negative gamma), C (event override, no new leverage inside 24 hours of a binary). If the gamma model is stale or disagrees with the tape, the tape wins and the model gets fired for the day. |
| Tripwires | An eight-indicator fragility meter with hysteresis: 5/8 red for two sessions halves levered exposure; 6/8, or a −2.5% index day, takes it to zero. Re-risk only after three calm sessions, in halves, leverage last. |
| Kill switch | −8% from the high-water mark within 20 sessions: all leverage off, five sessions cooling, written review of every trade before restarting at half size. |
| Evidence gates | New playbooks trade at paper or quarter size until 20 logged trades show positive expectancy after costs and a sample drawdown under 6R. Half size until 40. Full size after that. Fail a gate, go back one phase. |
| Override friction | Any deviation from the document gets written in the signal-change log before the order. Unlogged overrides count as tilt; three in a month means a mandatory week flat. |
2. The daily report
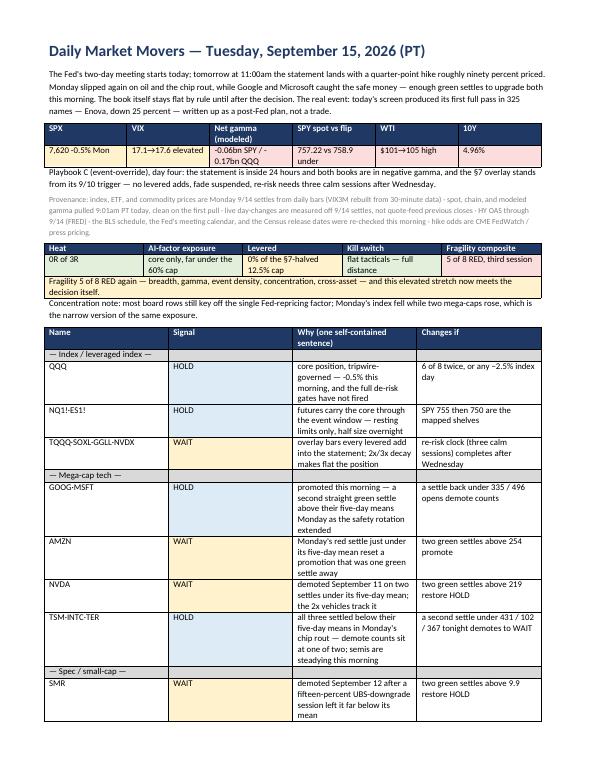
A Python pipeline runs every trading morning and puts out a five-page Word doc. Page one is a dashboard with almost no prose. The analysis is the appendix, not the product.
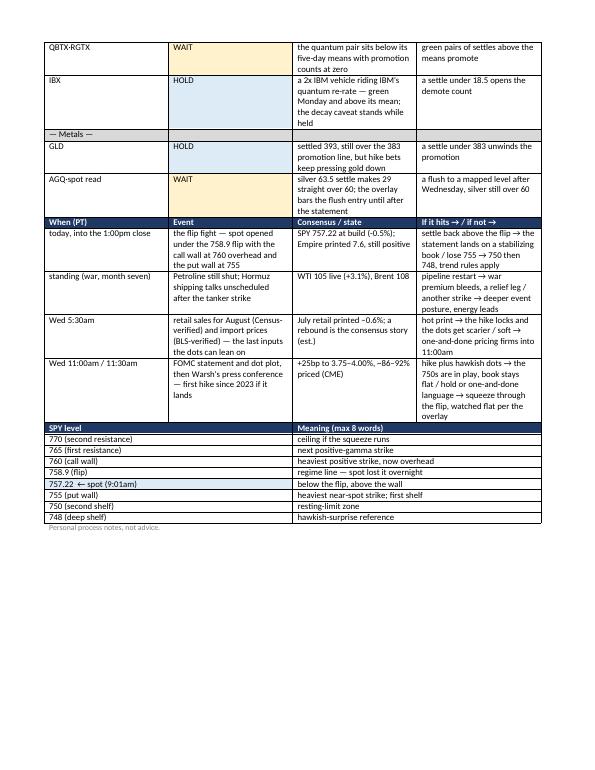
- Gather: settles and pre-market moves for a 20-name watchlist plus indices, VIX, oil, rates and gold; HY credit spreads from FRED; the SPY and QQQ options chains for a modeled dealer-gamma profile; the next seven sessions of catalysts, each date checked against the publisher.
- Decide: a regime strip (index, VIX, net gamma, spot vs flip, oil, 10-year), a risk strip computed from the rules (heat used, factor exposure vs caps, distance to the kill switch, fragility composite), and a signal board with one of five signals per name and the level or event that flips it.
- Screen: the day's biggest movers go through a small-cap mean-reversion filter. Most get rejected, and every one gets logged with its Day-2 and Day-5 outcome whether I traded it or not.
- Lint and log: the build enforces word caps, a fixed vocabulary and an "every fact appears once" rule, then appends the day's movers, signal changes and fragility reading to the log.
Sample issue: September 15, 2026 (dashboard and week-ahead pages)
3. What the log is for
To find out if there's an edge before I'm allowed to size up. So far the small-cap mean-reversion screen has logged 74 names and almost no passes. The rules treat that as zero evidence of edge, not as discipline, so it stays watch-only until the outcome data says otherwise. The fragility meter has its own accountability log: every elevated reading gets scored against the next five sessions, and its record (mostly false alarms) is why it gates leverage instead of forecasting.
4. The numbers
From my Interactive Brokers statement, all accounts combined, September 22, 2025 to September 21, 2026. Amounts in US dollars.
Most of the book worked. TSM was the best position (+$4.2K), and selling calls on TQQQ and NVDX added steady premium. Two positions undid all of it. IBX and QBTX are 2x daily single-stock ETFs, and together they are down $14.7K, realized and open. That is more than the other 23 tickers made combined (+$8.7K). Net over the year: −$6.0K mark-to-market after $312 in commissions.
What I take from it: a daily-reset 2x ETF on one company is two bets at once, the stock and the path, and in a drawdown both go against you. The rule set I wrote in June is built around that failure mode for tactical trades: leveraged ETFs count at their multiplier, rented leverage needs a price stop and a time stop, and no single name goes past 15% of equity.
The exception, stated up front. QBTX is a conviction position, not a tactical trade, and it breaks those caps: I've been adding to it on weakness to bring my average cost down, and as of the September 2026 statement it is about half the account. I'm holding it into December on the view that QBTS rallies. The rules govern everything else in the book; this one position is a deliberate override, and its result will show up in the next statement either way.
5. How it was built
The code (Python, python-docx, options analytics, charts) was written with AI help. I wrote the rules and the report spec, added the entry, exit and sizing logic, and read every issue before I do anything with the book. The trades are mine.
Personal account and process notes. Not investment advice. Figures are from the broker statement; account numbers are left out.