Market research · R
Why people cancel Netflix
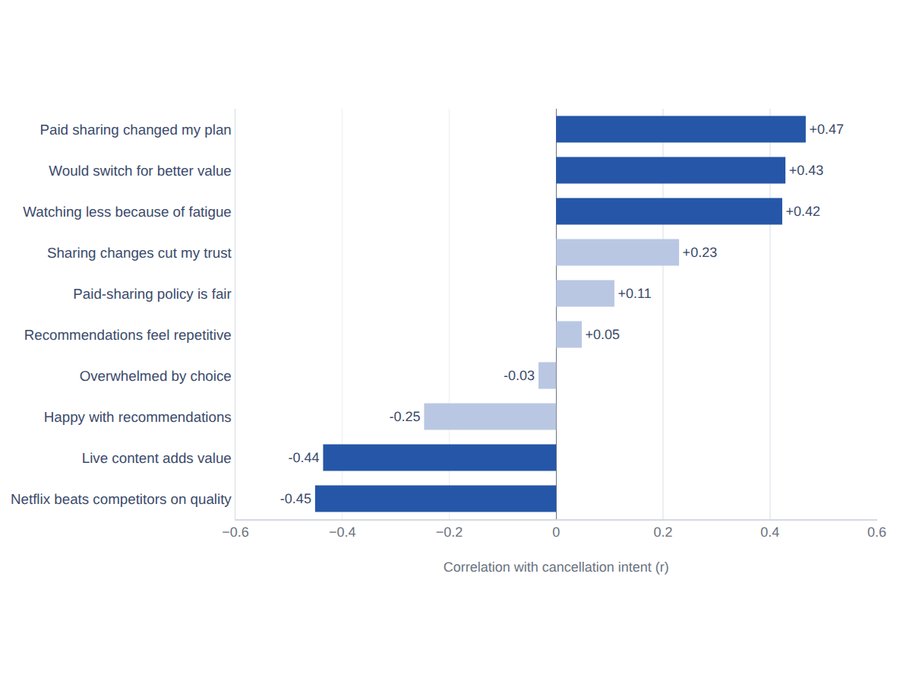
A 44-person survey on churn. Correlations, t-tests, a Friedman test and a regression that explains 66% of cancel intent. Paid sharing is the biggest driver, not the algorithm.
See the analysisFinal-year finance student at UBC Sauder. I trade, I write market reports for a small group, and I did the ESG side of an equity research pitch for the CFA Research Challenge. Looking for analyst roles in banking, research or markets for 2027.
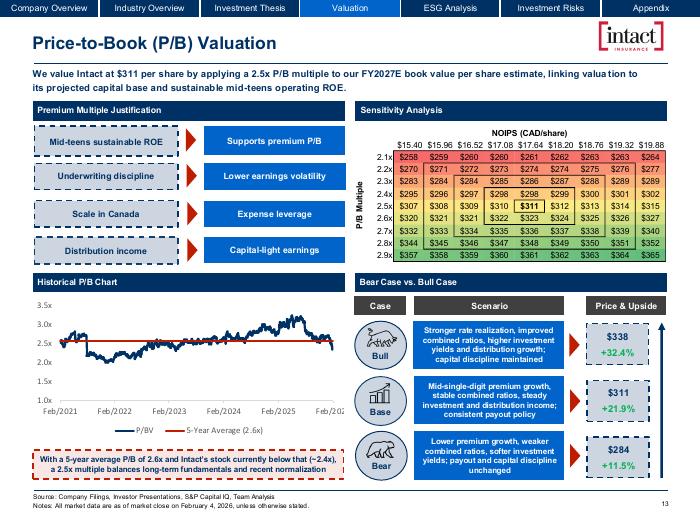
Our team's pitch for the CFA Research Challenge. P/B valuation, eight-company comps, bull/base/bear. I did the ESG chapter. The full deck is on the page.
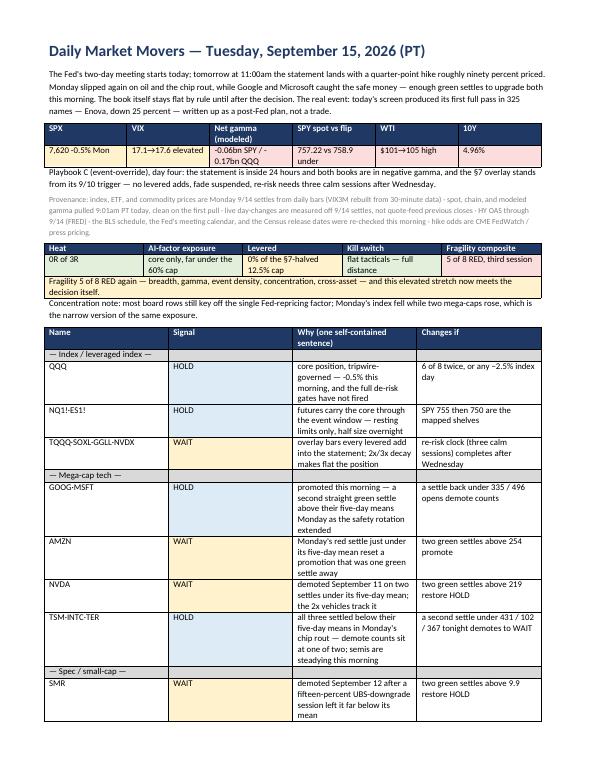
The rule set, the daily report that runs the book, and the real numbers: up to US$87K in capital, a −12.5% year, and what two leveraged ETFs taught me.
Reports I write for my trading group. Each one picks a question, works through positioning, options and macro, then makes a call and names the level that would prove it wrong.
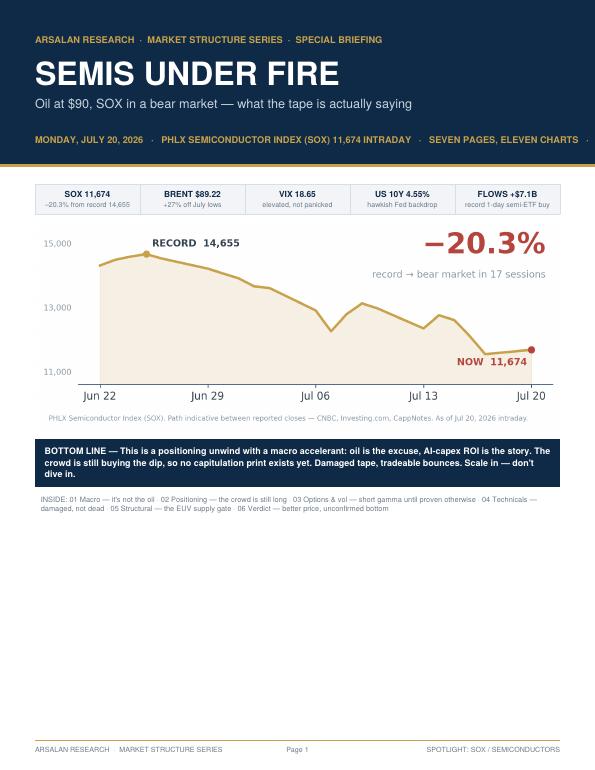
SOX 20% off its record: a positioning unwind, not a demand problem.
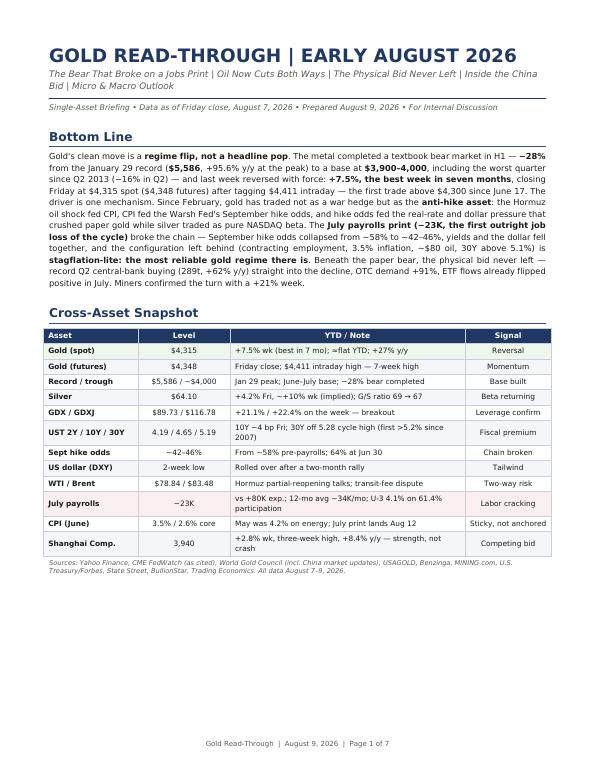
From a 28% drawdown to its best week in seven months.
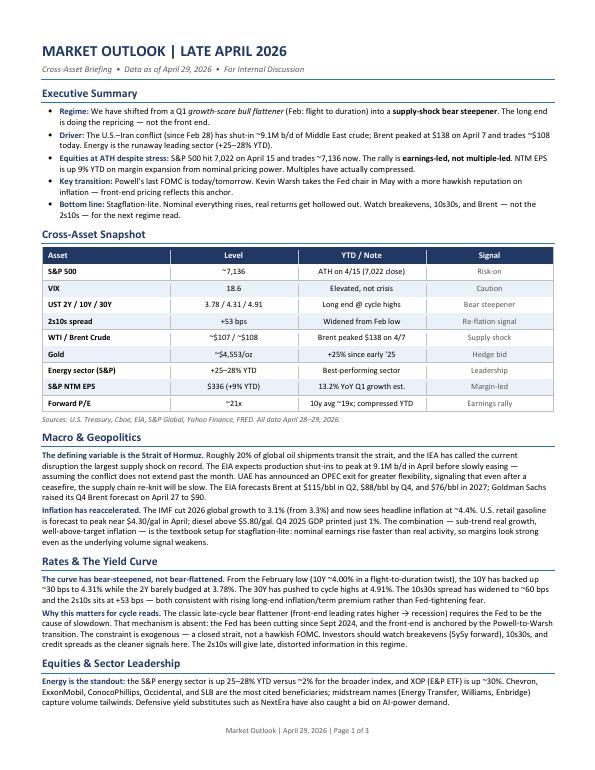
Why 2s10s was the wrong part of the curve to watch.
Everyone's been posting the "S&P 500 looks like 2000" chart. I slid the two windows against each other and computed the correlation at every lag to see how real the match is. It's mostly curve-fitting.
Open the dashboard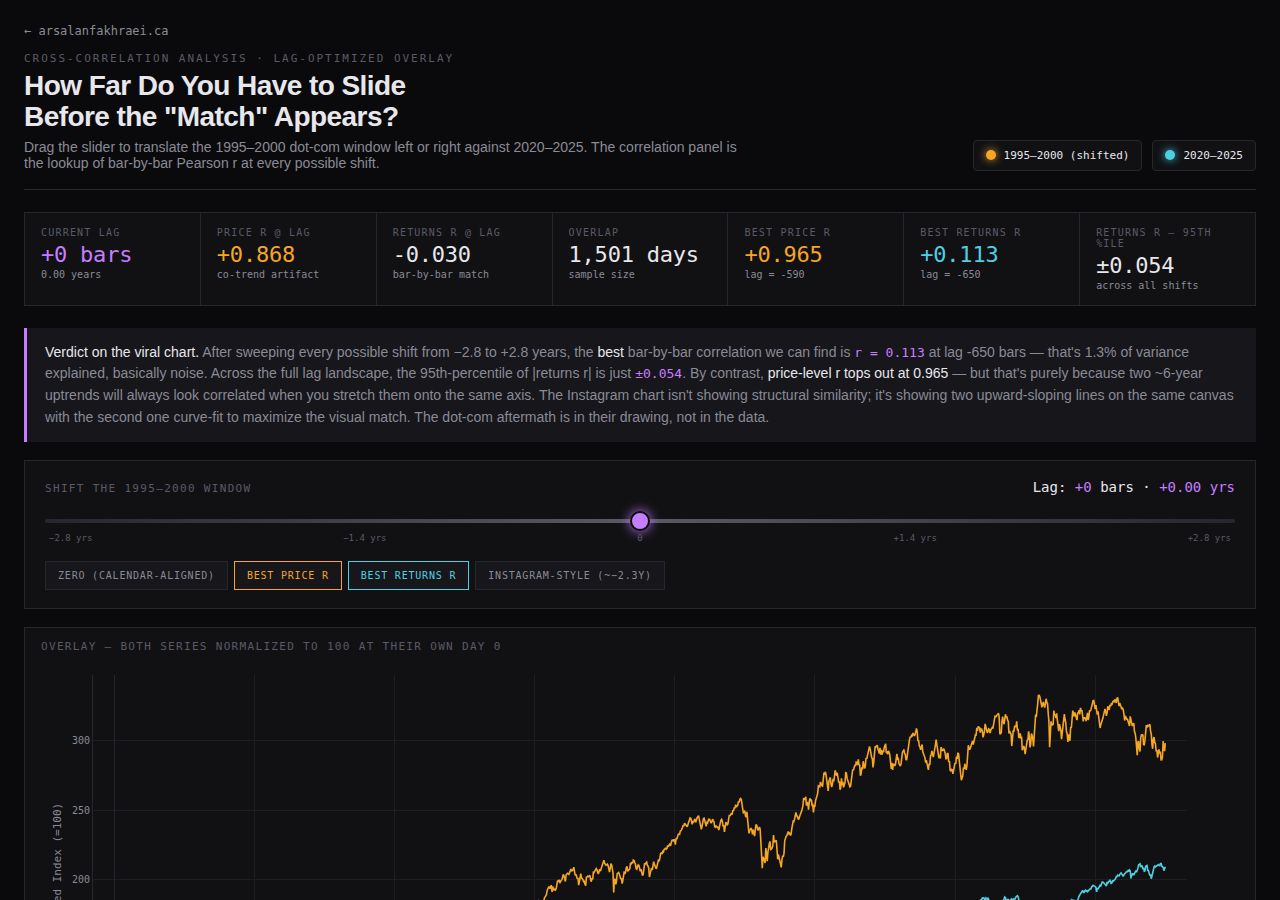
Projects from COMM 337 and 365. Learning SQL this term.
A 44-person survey on churn. Correlations, t-tests, a Friedman test and a regression that explains 66% of cancel intent. Paid sharing is the biggest driver, not the algorithm.
See the analysis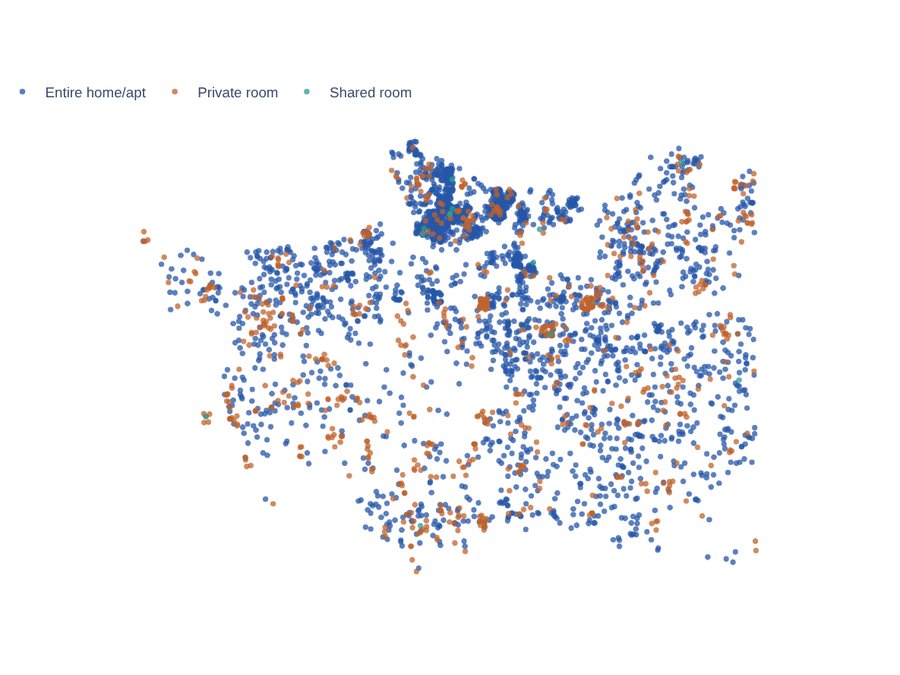
81% are entire homes and 40% belong to hosts with more than one listing. A map, neighbourhood breakdowns and the growth trend.
Explore it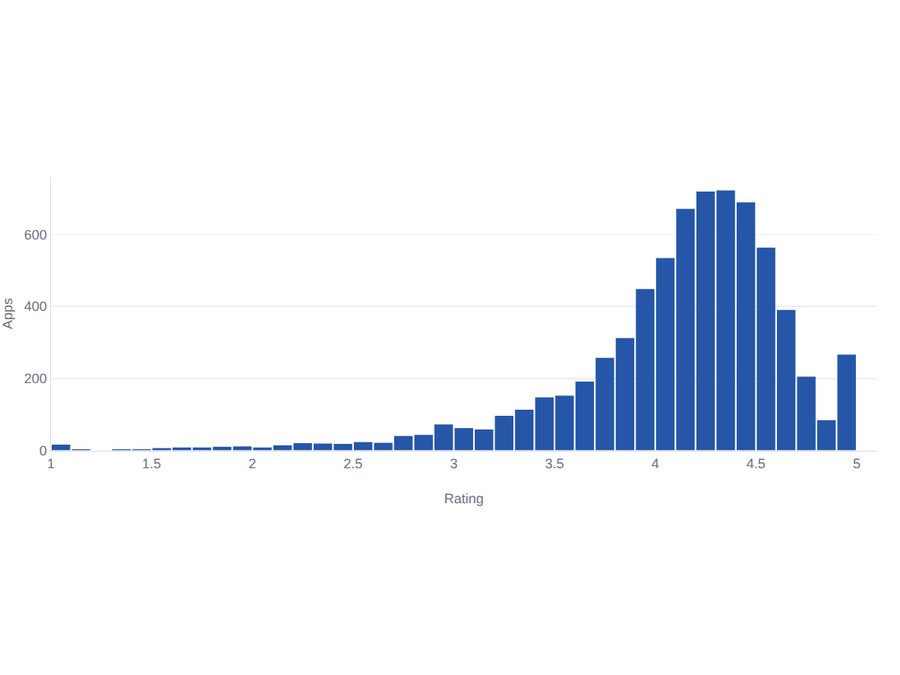
About 7,000 apps in pandas: crowded categories versus popular ones, why ratings say little, and why only 8% of apps charge.
See the findingsI grew up in Tehran, moved to Vancouver, did two years at UBC Okanagan and transferred to Sauder in 2024. Outside class I trade a live account alongside a group of four (a wealth manager, a commercial banker, two friends) and write the weekly read-through for them. I use AI a lot when I build things and I'm upfront about it; the ideas, the rules and the calls are mine.
Off the desk: tennis, violin, espresso, board-game nights, and slowly learning French.